Friday, September 30, 2011

3D Driving Directions


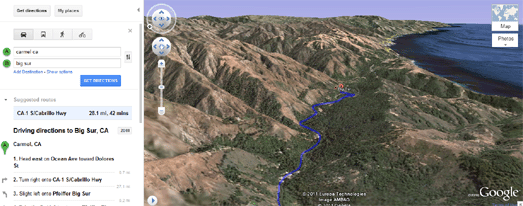
Google Maps has added the option to preview driving directions in 3D using the Google Earth plugin.

Now when you use Google Maps for driving directions you will see a 3D button next to your directions.


When you click on the 3D button the map will switch to the Google Earth view. An animated fly-through of your route will then be shown.

You can pause the flight at any time by clicking anywhere in the 3D view or on the pause button. It is also possible to jump to different stages in your directions by clicking on a step in the left hand panel.

Try a Flight

Via: Google Latlong

_______________

Explaining the Causes of Famine


Voice of America has used a series of Google Maps and over 10,000 separate data points on rainfall, food prices and refugee movement to explain How Somalia Descended into Famine.

The visualisation explains over a series of Google Maps how the non-occurence of last year's rain season in Somalia has led to crop failure, this year's spike in food prices and then widespread famine.

The rainfall map lets the user view rainfall levels throughout Somalia. If you click on one of the rainfall markers you can view a graph of rainfall at that location comparing 2010's rainfall with rainfall in 2009.

The food prices map allows the user to select different towns in Somalia and view graphs showing the sharp rise in price of a number of different crops and other essential commodities.

Finally the famine map provides a heat map of Somalia showing the scale of the famine at different locations in the country.

_______________

Friday Fun with Google Maps

The Electric Street View Acid Test

Asheville, North Carolina never really recovered from the 1960's. If you visit Asheville in Street View you can see how the whole town is still stuck in a weird psychedelic time-warp.

Average Breast Cup Size Map

Earlier this year Target Map released the Worldwide Penis Size Map. They have now released the Average Breast Cup Size Map.

I'm not going to comment on this map, as I know anything I say will just get me into trouble.

How to Make a Map Quilt

Robin Camille made a map quilt of Providence, R.I. with a little help from Google Maps. If the idea of having a map quilt inspires you then you can read all about how she made the quilt on her website.

_______________

Thursday, September 29, 2011

Robots Are Attacking on Street View


Robots from the year 2029 have been sent back in time to destroy you and your home!

Yes - the robots are here to get YOU!

Chaos in Your Town lets you create a blockbuster robot film featuring your very own street and house. Using Google Maps Street View as the background to the scenes Chaos in Your Town creates an incredible Flash based movie that shows robots walking down your street, targeting your house and blowing it to kingdom come.

This is the best thing you will see this week. Don't believe me? Then just have a look at the screenshots below - and then go and create your own movie.


_________________

Create a Google Map Based Photo Album


Codrops has created a very nice template and tutorial for a Google Maps based photo album.

This multi-level map and image gallery displays images related to their location. The first level of the map shows the location of places that have a set of images. If you click on a marker on the first level the map will zoom in and also display thumbnails of the photos at this location.

Clicking on a marker in the second level will result in the photo being displayed next to the map. The images can also be viewed in a lightbox and the map can be viewed in full-screen.

Check out the demo to see the map in action.

_________________

Wednesday, September 28, 2011

Where You Want To Go with Google Maps?


Where Do You Want To Go? is a great idea to get people to share the places they want to go and why they want to go there.

To submit a desired location users simply need to enter a destination and some brief thoughts about why they want to visit. Whenever a user submits a destination, the destination is Tweeted by timespentalone with a link to the user's Google Map.

The best submissions are added to the Where Do You Want To Go? main map. The main map rotates through the submissions to the site, showing a Google Map satellite view of the location and the submitter's thoughts.

My only complaint with the application is that the map is a little slow. I'd like the application to move onto the next submission after about ten seconds or maybe add a button so users can manually move to the next map.


The application reminds me a little of ZeFrank's A Childhood Walk

For his project Ze asked people to recreate a childhood walk in Google Maps Street View. He then put together a collection of the responses superimposed on top of the appropriate Street View image.

The exercise was very effective and seemed to touch the nostalgic yearnings in a lot of users.

_________________

The University of Montana on Google Maps


I came across this beta campus map of The University of Montana today. The map includes a couple of nice features to help students and visitors find their way around the campus.

The Google Map includes a transparent overlay that adds interactivity to the buildings on the map. Users can click on individual buildings and get links to the building's page on the university website and to printouts of floor plans of the building.

The map also includes a nice directions feature that allows users to quickly select and find walking, driving and bus directions between different locations at the university.

Other layers allow users to view photos, art exhibitions, bus-stops, parking spots, places to eat and wi-fi locations.

_________________

London Bus Waiting Times on Google Maps


Transport for London recently started beta testing a new Countdown API to provide real-time departure information for all buses at every bus stop throughout London.

Next Bus London has quickly released a Google Map that shows the location of London bus stops and informs you how long you will have to wait to catch a bus.

To find out exactly how long you will have to wait you simply need to click on a map marker and an information window opens displaying the bus number, destinations and waiting times for the next few scheduled buses at that stop.

_________________

Tracking Corruption with Google Maps


Having come across the concept of baksheesh more than a few times in my travels around the world I know how frustrating it can be to have to pay bribes to officials just to get them to do their jobs properly. It often seems that the practice is officially encouraged and that there is no point in reporting the incident.

In these situations it would be at least satisfying to be able to warn the rest of the world about the corruption.

The Corruption Tracker uses Ushahidi's map reporting system to allow users to report and map any corruption that they witness or are subject to.

Users can report corruption by sending an email, by sending a tweet with the hashtags '#corruption', '#bribe', '#anti-corruption' or '#theft', or by filling out a short form. Submitted reports of corruption then appear on the Corruption Tracker Google Map.

_________________

Tuesday, September 27, 2011

Watch Live Broadcasts on Google Maps


One of my favourite smartphone apps is live broadcasting application Bambuser. The application lets you broadcast live video straight from you mobile phone or a webcam.

The only bugbear that I used to have with Bambuser is that it didn't have a map of broadcasts happening right now, so that users could select from the currently live broadcasts geographically. Well, now it does!

The live Bambuser Google Map shows the location of live broadcasts, those recorded in the last 24 hours and even older recorded broadcasts. You can even watch the live streams directly from the map.

_________________

Help Needed for Missing GIS Analyst


Mark Bosworth, a GIS Analyst at Metro in Portland, has been missing since Friday September 16, 2011.

Mark is a cycle Oregon volunteer and was last seen walking to his tent in Riddle, Oregon. Mark's family think that he may have had a recurrence of cancer that has caused him to become confused and possibly lose his memory.

There have been several sightings of someone fitting Mark's description hitch-hiking near I-5. Therefore Mark's family and friends have been distributing flyers up and down the I-5 corridor. This Google Map is being used to help plan where the flyers have been and need to be distributed.

If you are able to help with distributing flyers you can print them out from the website launched by Mark's family - findmark.org. You can then use the map to see the areas where flyers still need to be distributed.

_________________

The Google Map of the Internet


The Web 2 Map is a metaphor of the internet, as seen by the organisers of the Web 2.0 Summit. The map assigns territories or 'countries' to different sectors of the internet, for example 'social networks', 'search' 'e-commerce' etc.

This year the map also includes a data layer. The data layer adds what might be seen as capital cities to the map. The buildings or skyscrapers in the city act as a metaphor for the different data segments within the dominant player in that sector.

For example, the Union of Social Networks includes a Facebook capital city. The Facebook city is dominated by a 'social' skyscraper but also includes a smaller 'location' building to reflect that Facebook also now includes check-ins etc.

_________________

Monday, September 26, 2011

Side-by-Side Street View Comparisons


I missed this impressive use of custom Street Views by the New York Times when it was published back in May. However it is so good that it is worth posting even this long after the event.

Panoramas of Joplin Before and After the Tornado uses Google Map Street Views of Joplin side by side with panoramas taken after the Joplin tornado hit.

A number of newspapers have created clever visualisations of the damage caused by natural disasters by using before and after satellite imagery. For example both ABC News and The NYT published comparisons of satellite imagery of Japan before and after this year's earthquake.


The New York Times however are the first newspaper to create a before and after visualisation using Street View. The paper took a number of 360 degree photos of areas of Joplin after the May tornado. They then used the Custom Street View functionality in the Google Maps API to create Street Views from their panoramas.

The custom panoramas have been placed side-by-side with the Google Maps Street Views from the same location. As you pan the Street View the custom panorama moves to show exactly the same view, to show the devastation caused by the earthquake.

Via: Google Maps for Journalists

_________________

Tracking Google Maps with Google Analytics


Ubilabs has written up a very cool explanation of how you can track users' interactions with Google Maps using Google Analytics.

The trick involves using Google Analytics event tracking on your map. For example you can add a tracking event to map markers to see how many times users click on different markers.

Ubilabs say that they regularly use Google Analytics on their created maps to track map types used ('map', 'satellite', 'hybrid' etc), location search (geocoding requests) and map marker and drag events.

This is a really inspired idea. I can't wait to try this on some of my own maps.

Track Maps using Google Analytics

_______________

Restaurant Inspections on Google Maps


The Seattle Food Inspection Map lets you examine the food inspection ratings for Seattle restaurants.

The map includes a nice slider function that allows you to search for restaurants in Seattle based on the inspection score. For example, you can set the slider to show only restaurants that have a score between 0-45 (a score of over 45 indicating a poor inspection).

Alternatively you could search for restaurants that you might want to avoid by setting the slider to only show restaurants with a score over 45.


NYC BigMaps have used the Your Mapper map creation tool to map restaurant inspections and 311 service calls in New York City.

The restaurant inspections map displays New York City Department of Health inspections across 5 boroughs since Jan 2008 (22,440 restaurants). You can search the map by category, date range, keyword, and location. The map then displays restaurants on the map at the location you searched.

Green map markers indicate restaurants with no health violations.

_______________

Shaded Relief with Google Maps


The Shaded Relief Map fills in a couple of Google Maps missing map types.

As well as providing the usual satellite, map and hybrid layers the Shaded Relief Map includes a shaded relief and a natural map layer. The natural map layer displays Tom Patterson's Natural Earth map.

The Shaded Relief Map also includes a number of handy tools. Users can click anywhere on the map to find the elevation at that point. Users can also measure the distance between two points on the map and measure an area, for example a building or piece of land.

Via: Landkartenblog.de

_______________

Sunday, September 25, 2011

Google Maps of the Week


This week I was really impressed with the update to Planefinder.net, the real-time plane tracking website.

Now as well as tracking thousands of planes in real-time around the world you can also play back any day's flights. The playback option allows you to select a date, the number of hours you wish to view and even the speed of the animation.


The Wall Street Journal's Census Map Maker is another great idea for a map.

Once you have logged into the Census Map Maker with your Facebook or Twitter account you can start building your own census map for any neighborhood in the USA.

At the moment the Census Map Maker only includes block level census data on race but there are plans to add more data from the rest of the census soon. When more census data is added to the map this will be an incredibly powerful application.

_______________

Saturday, September 24, 2011

Create Your Own Census Google Map


The Wall Street Journal's Census Map Maker lets you create your very own census map for any neighborhood.

Once you have logged into the Census Map Maker with your Facebook or Twitter account you can start building your map. To create a map you simply need to click on the census blocks that you are interested in on a Google Map and then press 'save'.

That is essentially it. Once you have clicked on your chosen census blocks you have your very own census map. The map can show the race breakdown for each block you clicked and for the entire selected area. The map even comes with it's own pie chart of race and ethnicity in your defined neighborhood.

At the moment the Census Map Maker only includes block level census data on race but there are plans to add more data from the rest of the census soon.

_______________

Friday, September 23, 2011

Berlin Elections on Google Maps


The Beliner Morgenpost has used Fusion Tables to create this nice Berlin Elections Map. The election was held on September 18th to elect members to the Abgeordnetenhaus. All 141 seats were up for election.

The map allows you to click on any of the political parties and view the constituencies where their candidates won. It is also possible to search the map by address or by district to view local results.

_______________

Friday Fun with Google Maps

Then Turn Left at the Moon

If you ask for directions between Jarsy and Meylan in France you will eventually come across this Google Maps glitch. If you follow the blue suggested route in Street View Google tries to send you to Meylan via an intergalactic detour.

Running the Alphabet

Running the Alphabet is a website devoted to, well, running the alphabet. This project by the designer and runner Joan Pons Moll aims to create a complete typeface by using a GPS unit and two quick feet.

UFO in Finland

Street View Funny has found another glitch in Google Maps Street View. Or is a glitch? Maybe it is the final proof that we are being visited by aliens.

Google Map Rugs


Las Vegas designer David Hanauer creates beautiful rugs based on Google Maps satellite views.

_______________

Thursday, September 22, 2011

Fluglärmkonturenkarten on Google Maps


DFLD Radar is a Google Map of real-time air traffic over Europe.

There are quite a few live aircraft tracking maps already but DFLD Radar has a nice USP. DFLD Radar colour-codes the aeroplane map markers by altitude. The redder map markers indicate that the plane is flying at a lower altitude and the greener markers show planes flying at a higher altitude.

You can also click on any of the plane markers to read further details, such as the type of plane and vertical speed.


One consequence of all that aircraft traffic over Europe is quite a lot of noise pollution. Fluglärmkonturenkarten (you really do have to admire Germany's skill in eradicating those useless spaces that other languages insert between words) is a series of Google Maps showing noise pollution around Frankfurt Airport.


These heat maps show noise levels around the airport using data from 2007 and also show noise level predictions for 2020 in two different traffic modes.

Hat-tip: Bartalis

_______________

Aerial View Transitions


Google have added some cool transitions for the 45° imagery (Bird's Eye view) in Google Maps. Now when you zoom in and out of the 45° imagery in Google Maps there is a smooth transition between the different zoom levels. Google have also added transitions when you rotate the imagery.

The transitions only work in Google Chrome at the moment. To see the transitions in effect check out this animated view of Venice in Google Chrome.

_______________

1930's Connecticut on Google Maps


Neighborhood Change in Connecticut lets you view aerial imagery of Connecticut from 1934 side-by-side with the modern satellite view on Google Maps.

This map, created by the Trinity College and University of Connecticut Libraries Map and Geographic Information Center, lets you explore the changing landscapes of Connecticut from the 1930's to the present. The dual map control allows you to zoom in on different areas and compare the past and present views. For example, in the picture above you can see commercial development on formerly rural farmland.

As well as imagery of Connecticut from 1934 the map includes aerial imagery from 1990, 2004 and 2006.

Also See
_______________

Wednesday, September 21, 2011

Throw a Dart at Google Maps & Take a Snap


In April 2011 over 250 creative St. Louisans gathered to throw darts at a huge map of the City of St. Louis. Participants then had one month to visit the area where their dart landed and take a photograph.

DART St. Louis 2011 is a Google Map of the resulting collection of photographs. It provides a wonderful snapshot of St. Louis as it is today, one random block at a time.

________________

Das Boot on Google Maps


Uboot-sim! is a Google Maps based game, inspired by WWI submarine combat. In the game you control submarines in the North Sea and the Atlantic sea, hunting freighters and avoiding dangerous destroyers.

You can move your ships and hunt down your opponents' boats by right clicking on the map. The game includes some clever collision detection algorithms, which means you can't move your ships over land.

If your ships get destroyed by your opponents you can build new ships and U-boats in your dockyards.

________________

1930's Satellite View on Google Maps


The New Jersey State Atlas is using Google Maps to showcase aerial photography of the entire state taken in the 1930's (OK ... I admit there is no satellite imagery from the 1930's).

The opacity of the aerial photo layer can be adjusted. This means it is possible to compare the aerial view of the state in the 1930's to Google's current satellite imagery and observe how the state has developed over the last 80 years.

The map also includes the option to view Google Maps's annotated roads and to switch to the map view. It is therefore very easy to find locations in the state that you might want to see with the 1930's aerial view.

Also See
________________

A Better Static Street View Image Wizard


Over the weekend I created and posted a very simple Static Street View Wizard to help create the URL for a static Street View image using the new Street View Image API.

I needn't have bothered as Giacomo Andreucci has only gone and released a much better wizard called Google Street View Generator. Giacomo's wizard even lets you set the size of your Street View static image and can display a preview.

Using the wizard I produced the URL for the image of the Colosseum above in a matter of seconds.

________________

Tuesday, September 20, 2011

Win a Dodge with Google Maps


Chrysler Dodge are currently running a competition on YouTube to win three brand new Dodge cars. The first two cars have already been claimed but the third and final Dodge can still be won.

The Dodge Journey will be releasing a number of video clues on YouTube on the 24th of this month. You need to follow the clues in the video to discover the secret location where the Dodge has been hidden. Then with the help of Google Maps you need to actually get to the secret location to claim the car.

The Dodge Journey page on YouTube currently shows a Google Map and the five video clues for the last competition. You can watch the videos and view the location answers for each clue on a Google Map. The map also reveals the secret location where the car was hidden.

Remember - the third and final competition starts on 9/24/11.

________________

Worldwide Google Map of Speed Traps


Blitzer.de is a new Google Map, and Android & iPhone app which has a huge database of speed traps around the world.

Blitzer.de is the latest application from the ever impressive Ubilabs. The app allows you to view the location of speed traps in your region and around the world. More than 2,000 mobile speed traps are reported by the blitzer.de community per day.

The application allows users to search by location and filter results by fixed speed traps, mobile cameras and all speed traps. The speed trap markers include speed limits where available. Users of the map and the mobile apps can also add speed traps that are missing from the map.

________________

Track Planes in Real-Time with Google Maps


Planefinder.net, the real-time plane tracking website, has made some very impressive updates to their Google Map.

Now as well as tracking thousands of planes in real-time around the world you can also play back a whole day's worth of flights. The playback option allows you to select a date, the number of hours you wish to view and even the speed of the animation. You really should zoom out on the USA, set the time to 23 hours and the speed to 120x and watch a day's worth of flights.

Another nice update in this new release of planefinder.net is the custom information windows. If you select an individual plane you can view a picture of the plane, the flight and flight details, download a KML of the flight path, zoom the map to fit the entire flight path and share the track on Twitter and Facebook.

________________

The Cable Map Guy


TeleGeography's Submarine Cable Map is a real thing of beauty.

The map depicts 188 active and planned submarine cable systems and their landing stations around the world. Both the cables and their landing points on the map are interactive. Clicking a cable provides access to data about the cable, including the cable’s name, ready-for-service (RFS) date, length, owners, website, and landing points. Clicking a landing point reveals a list of all submarine cables landing at that station.

The map makes great use of Google Map styles and custom info windows to create a map that is both functional and great to look at.

Also See

Greg's Cable Map

Hat-tip: Street View Funny

________________

Monday, September 19, 2011

Typhoon Tracking with Google Maps


Agora's Digital Typhoon - Track Forecast Map tracks tropical cyclones in and around Japan. The map shows the historical tracks of current typhoons and also shows their predicted path.

The map is currently showing the paths of typhoon Roke and Sonca. When the map first loads an animation of the typhoons' path is displayed on the map. Different coloured markers indicate the typhoon's wind speed at different points along its path.

The numbered red map markers show the predicted path of a typhoon. Each marker includes a radial polyline showing the probability circle of the typhoon's location. You can also click on the markers to view the predicted wind speed.

________________

Role Playing Games with Google Maps


Obsidian Portal is an online platform for running and organizing table top role-playing games.

Using the platform gamers can can build campaigns and find other RPG gamers. The platform also includes an option to easily create a Google Map of your campaign world. Users can create campaign maps from any JPEG image.

The map can include map markers to show the position of cities or other important locations in a campaign. The map markers can also include links to a users Wiki page for the mapped location.

________________

New Danish Parliament on Google Maps


Microformats.dk has created a simple visualisation of the new members of the Danish parliament following the general election on the 15th September.

Borgen 2011 uses the Google Maps API with an image of the country's members of parliament. Using the CASA Image Cutter the photograph was turned into map tiles and mapped with the Google Maps API.

Users can now zoom in on the image and view individual MP's. The visualisation could be made even more interactive by adding event listeners to the map, so that when a user clicked on an individual MP's image an information window opened with biographical details.

________________

Sunday, September 18, 2011

Static Street View Image Wizard


Last week Google released a Street View Image API to quickly and easily add a static image of a Street View to a web page.

The API is very easy to use if you know the latitude and longitude of a location and you know how to work out the heading and the pitch of a Street View.

Unfortunately a lot of people don't.

I've therefore created this very simple Static Street View Wizard to help you create the URL for a static Street View image. Once you have generated the URL of a static Street View, using the wizard, you can just cut & paste it and add it to a website as you would the code for any other image.

I haven't yet added options to change the width and the height of the image. However, if you look at the generated URL you should be able to see how to manually change those settings for your image.

________________

Saving Post Offices with Google Maps


The U.S. Postal Service announced this week that it will be studying 251 mail processing facilities for consolidation. If all of these plants were to close, it would reduce the area mail processing network by over half, presumably at a huge cost to delivery times.

The website Save the Post Offices has created a Google Map showing the location of the 251 mail processing facilities that may be closed down, Processing Facilities Under Study for Consolidation Map.

Save the Post Offices has also created Google Maps to show the location of Post Offices Closed in 2011, 3,653 Post Offices Under Study for Closure under RAOI and 727 (non-RAOI) Post Offices Under Study for Discontinuance.

________________

Google Maps of the Week

Envolez-vous!

Ad agency Biborg has created an award winning banner ad game for YouTube, using Google Maps and HTML5. Envolez-vous! allows users to fly a hot air balloon around the world on Google Maps.

When you first load the map you can share your location to fly the balloon over your own home with Google Maps satellite view. The game includes some quick links to famous locations in France so you can quickly fly your balloon to the Eiffel Tower, Versailles and other interesting locations in France.

GIS Cloud
GIS Cloud is a powerful free cloud based GIS service, that allows users to create, edit, analyze and publish data from only one GIS service.

When creating a map with GIS Cloud users can choose from a number of base tiles, including OpenStreetMap, Bing Maps and Google Maps. Users can then add GIS data to the map, either from data already hosted on GIS Cloud or from their own files.

GIS Cloud projects can be shared, either by sharing the GIS Cloud URL of the project or by embedding the map in your own website. GIS Cloud also comes with a REST API and a JavaScript API.

________________